Every shapeof thinking,drafted.
Flowcraft turns a sentence into the diagram, chart, or illustration you were about to draw by hand. Describe it. It's drafted.
Six instruments for
one visual mind.
Every diagram type, illustration format, and chart style you'd reach for — drafted from a sentence.
From thought to
finished sheet.
Three movements. No dragging, no snapping to grids, no toolbar archaeology.
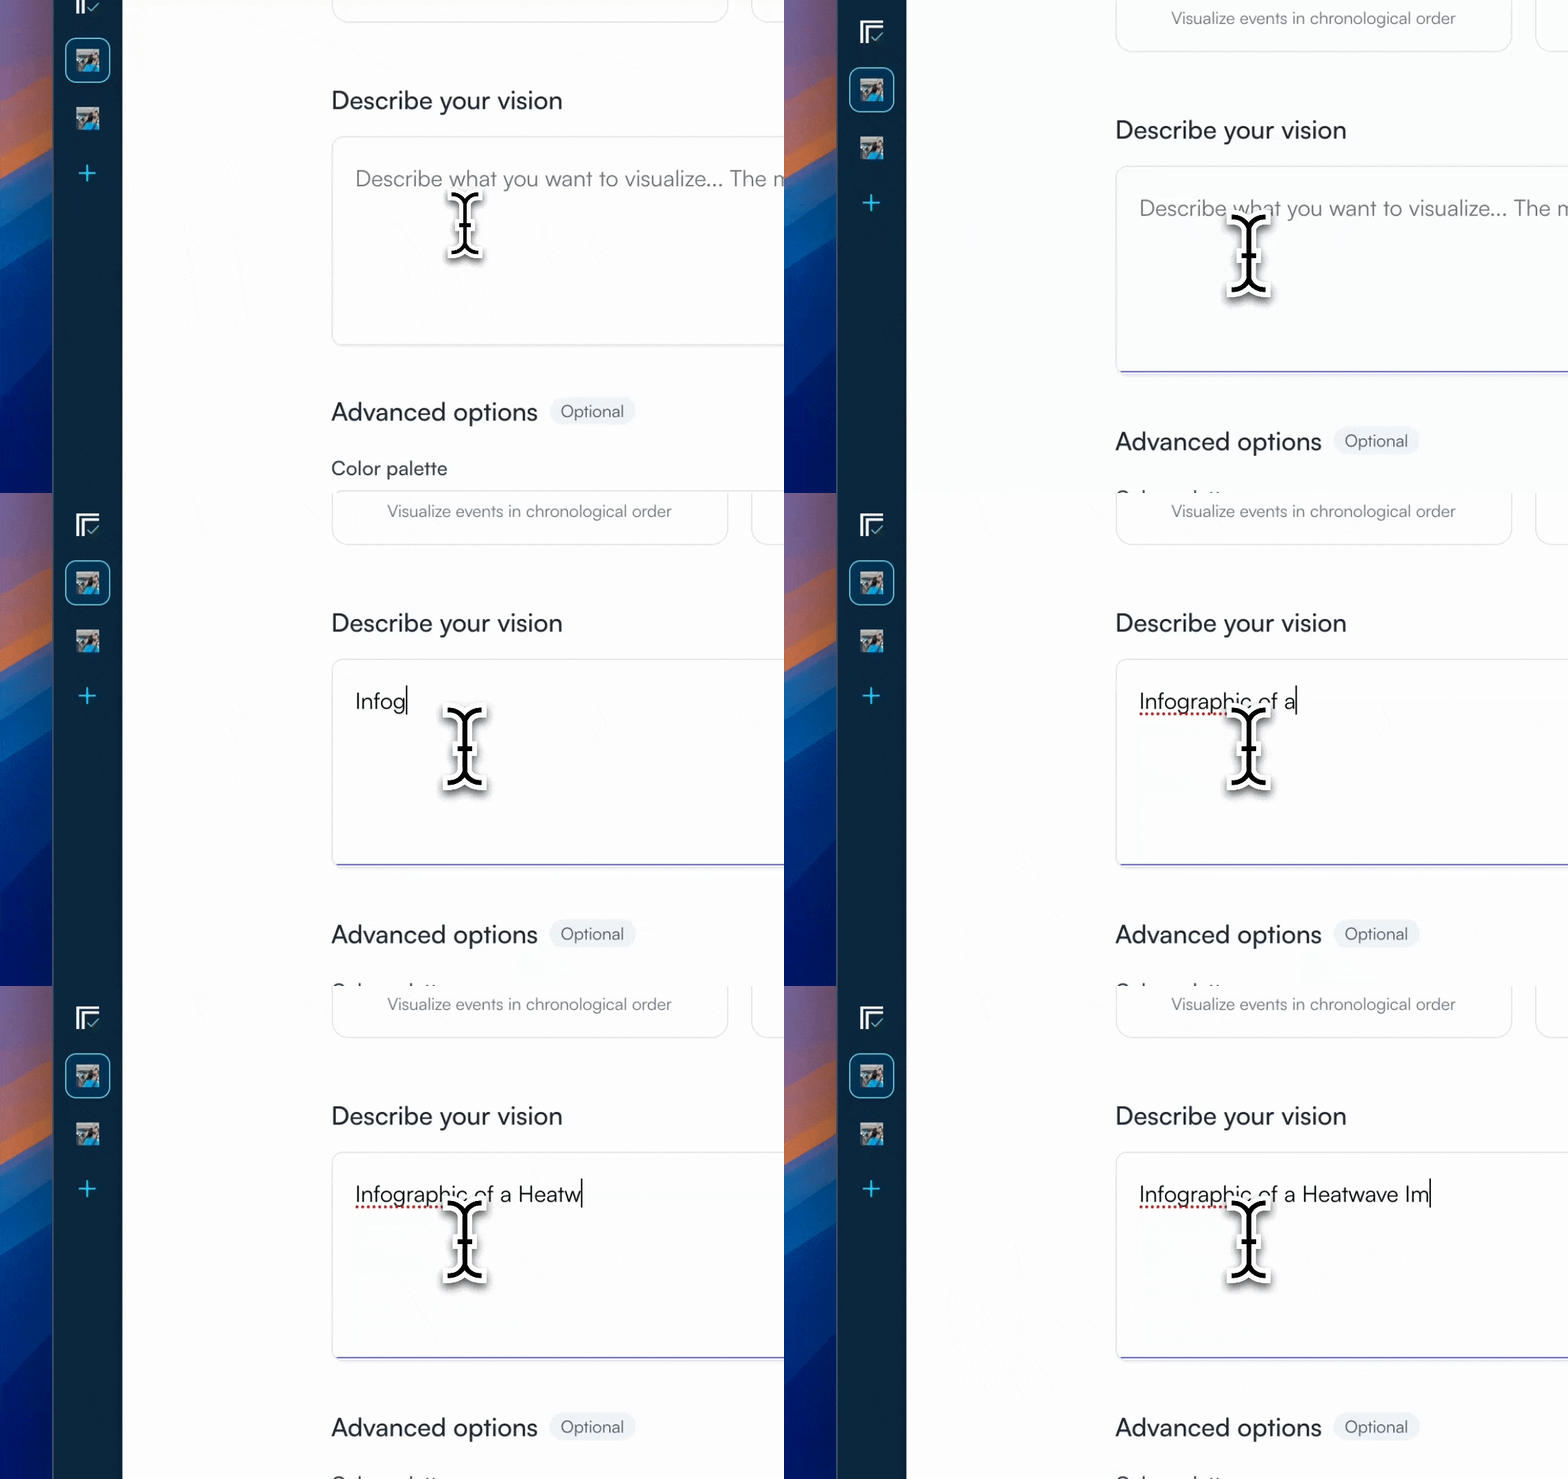
Describe.
Type a sentence or paste a doc. Flowcraft reads the structure of what you mean.
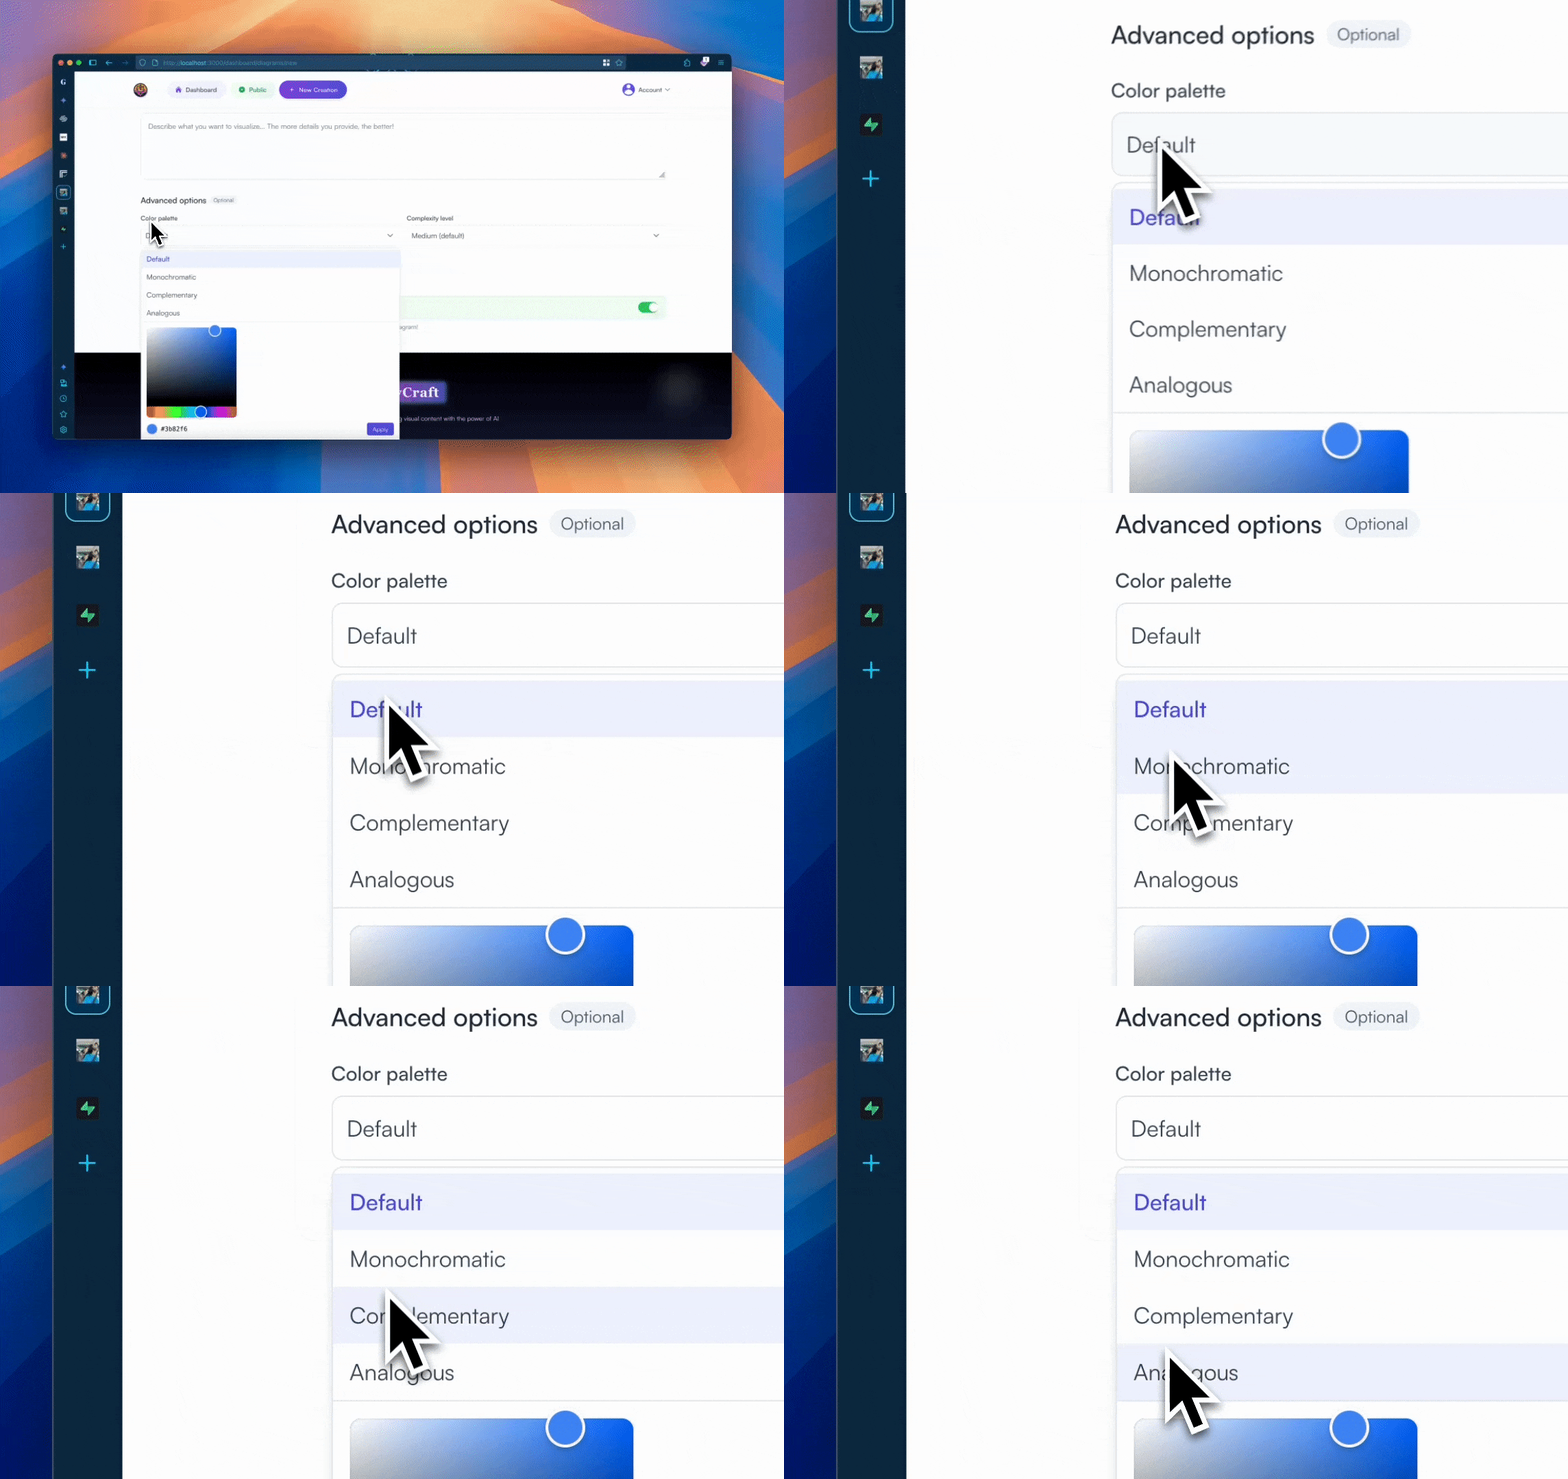
Style.
Pick an aesthetic — editorial, technical, hand-drawn, corporate. It commits to one voice.
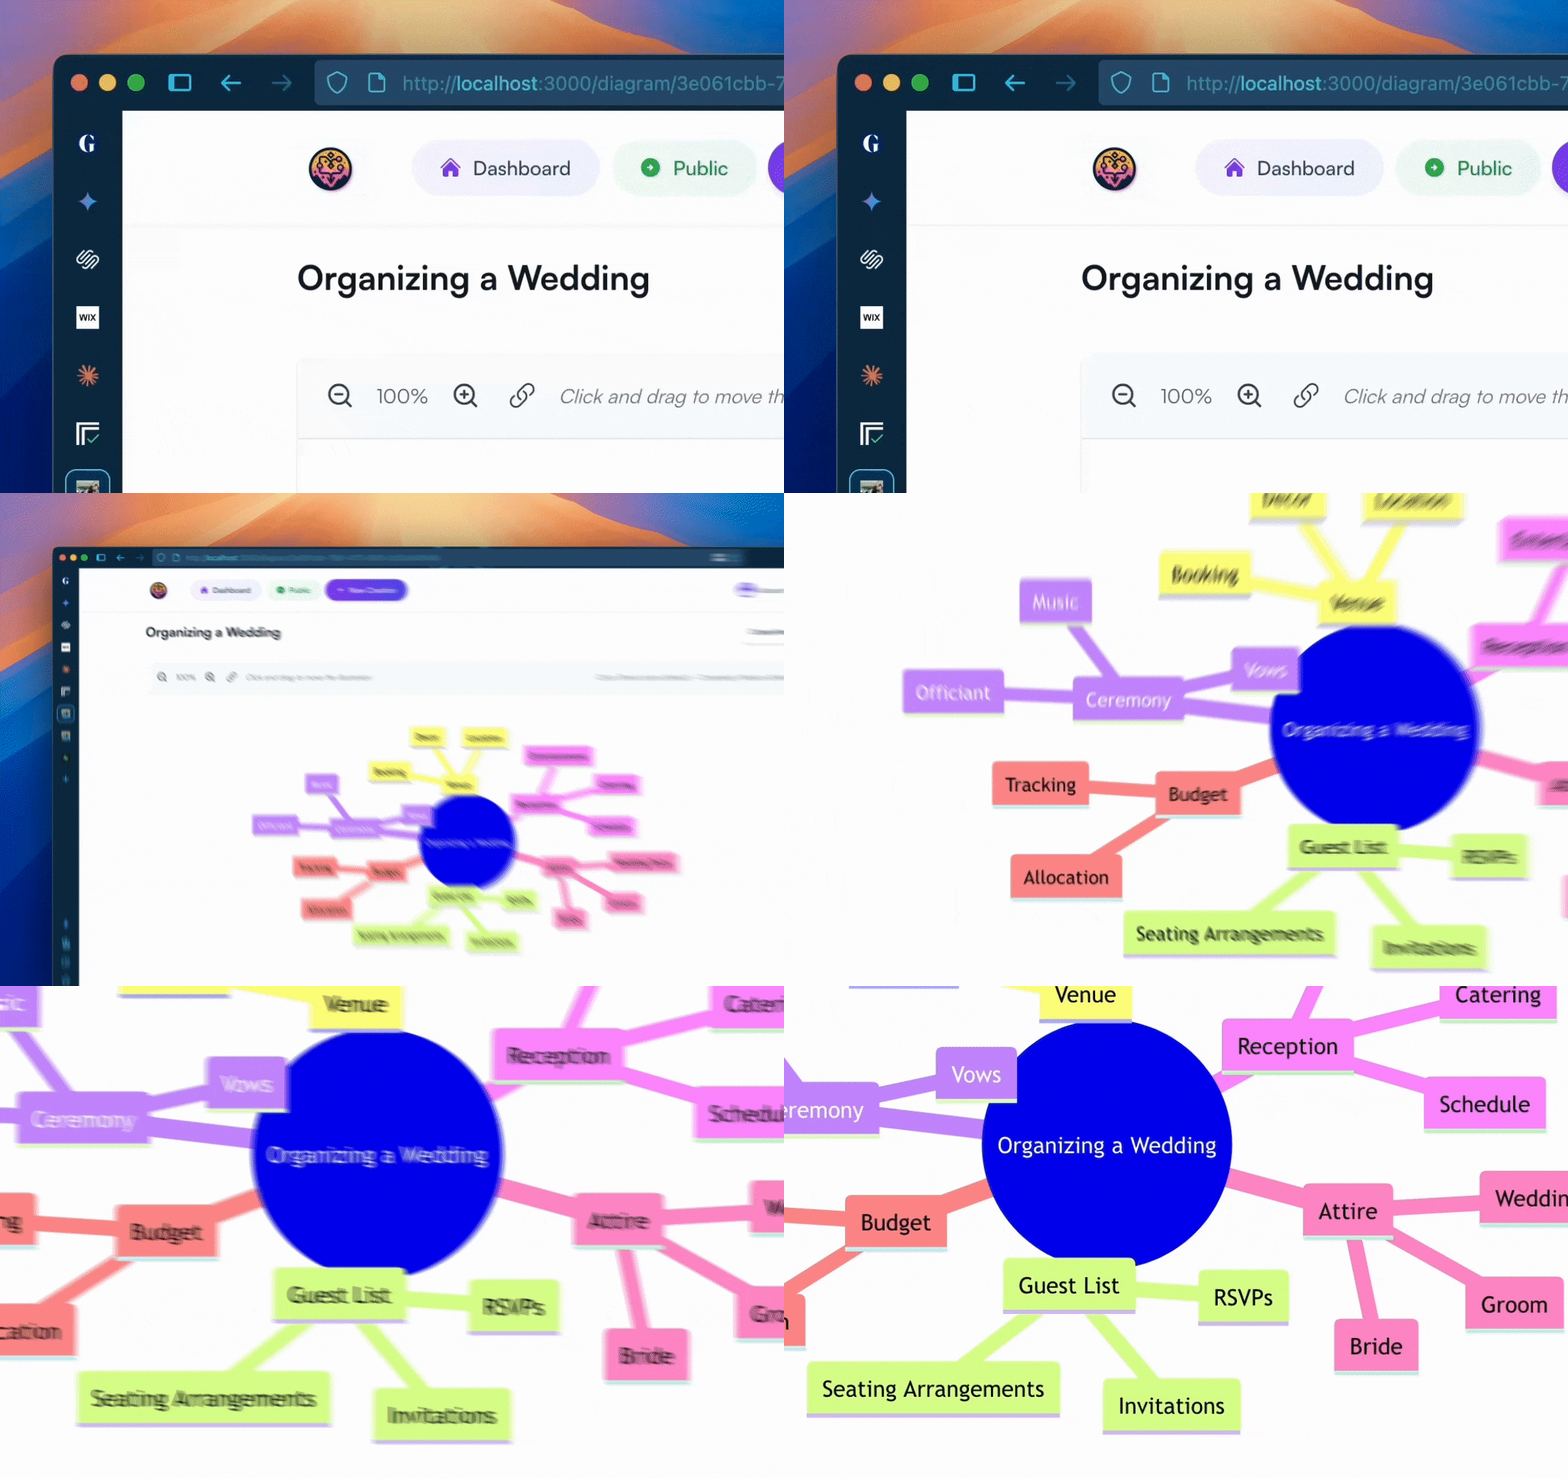
Refine.
Watch the draft render. Nudge any element. Export at any resolution.
Built for people who
draw to understand.
Engineers, educators, analysts, founders — anyone whose thoughts need a shape.
Knowledge sharing
Explain algorithms or system interactions visually for onboarding and training.
Process mapping
Visualize and optimize workflows. Identify bottlenecks. Improve efficiency.
Stakeholder decks
Communicate ideas and complex concepts to clients and team members.
Data visualization
Turn raw data into pie charts, bar graphs, and visualizations that drive decisions.
User flow
Visualize user journeys and wireframes. Accelerate ideation and testing.
System architecture
Plan and communicate the structure of complex systems at a glance.
Draft what you're
thinking. Now.
◆ Free tier · No credit card · Exports in PNG / SVG / PDF